
AI analysis for your business data

Bring your data. Get answers you can use.

Add your business files, analyze them through chat, and turn insights into dashboards and memos—with PDF and PowerPoint exports. No SQL or BI expertise required.

  • Chat analysis
  • Dashboards
  • Memos
  • PDF & PowerPoint
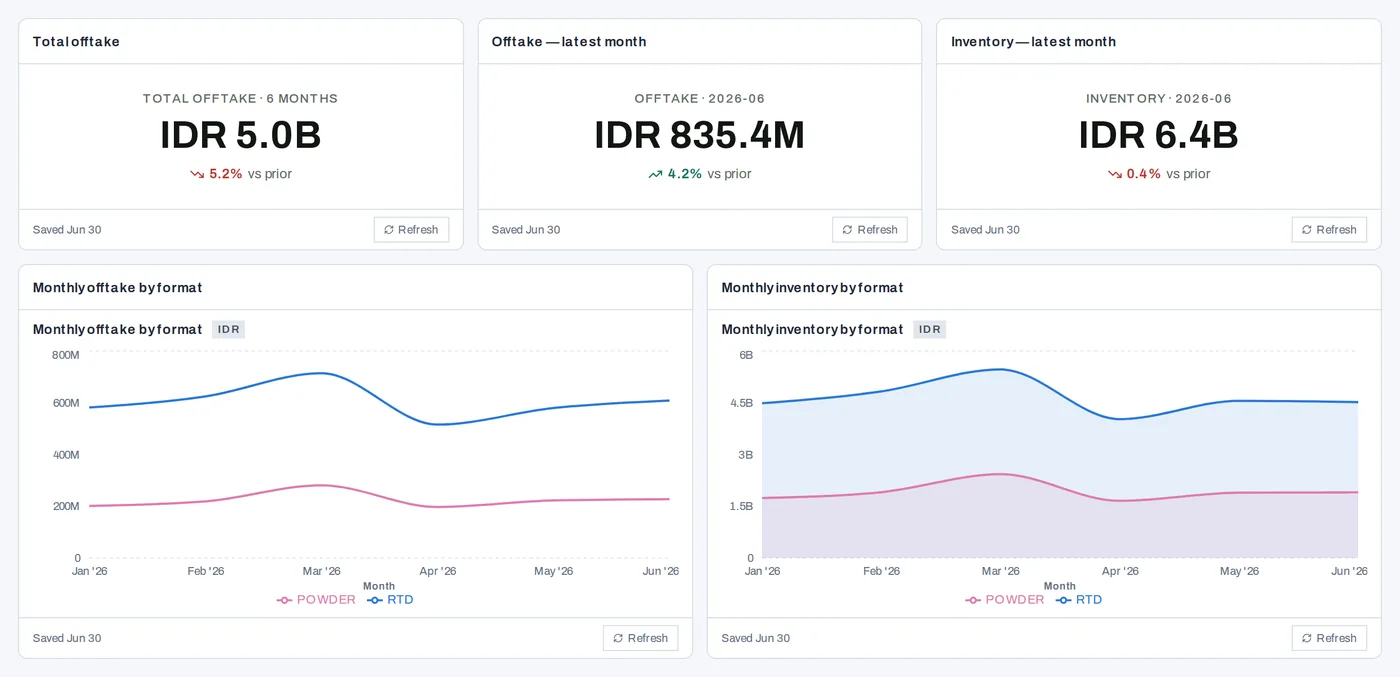
A Cognizon dashboard: total offtake (sales) IDR 5.0B, latest-month offtake IDR 835.4M and latest-month inventory IDR 6.4B, above two six-month trend charts split by product format.
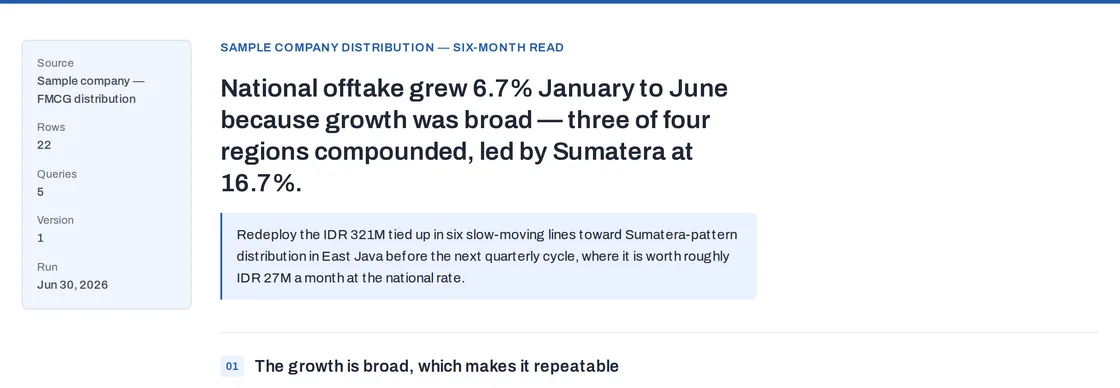
The top of a Cognizon memo: the finding that national offtake (sales) grew 6.7% January to June because growth was broad, led by Sumatera at 16.7%, and a recommendation beneath it to redeploy slow-moving stock.
The dashboard, and the memo that explains it.

How it works

From scattered reports to answers you can use.

Cognizon lines up your reports, builds the dashboard, and answers the next question with the evidence beside it.

Sample analysis

Your data starts in different places.

Sales Transactions

MonthSKUOutletSales (IDR)
2026-01S70081A00394,315
2026-02S70081A00404,235
2026-03S70081A00491,769
2026-04S70081A00327,795

Inventory Balances

MonthSKUOutletStock (IDR)
2026-01S70081A00397,628
2026-02S70081A00715,549
2026-03S70081A00589,488
2026-04S70081A00541,134

Products Reference list

SKUFormatSegment
S7008RTDCORE
S7022POWDERCORE
S7013RTDVALUE
S7025POWDERCORE

Outlets Reference list

OutletChannelArea
1A00MinimarketGreater Jakarta
1A01MinimarketGreater Jakarta
1A02SupermarketGreater Jakarta
1A03General TradeGreater Jakarta

Bring the context together.

Fields, lined up across the four reports
FieldColumnIn
MonthmonthSales · Inventory
SKUsku_codeSales · Inventory · Products
Outletstore_codeSales · Inventory · Outlets
Sales (IDR)offtake_valueSales
Stock (IDR)inventory_valueInventory
FormatstageProducts
SegmentsegmentProducts
ChannelchannelOutlets
AreaareaOutlets
  • SKUSales · Inventory · Products
  • OutletSales · Inventory · Outlets
  • MonthSales · Inventory

One model, ready for analysis

● SKU■ Outlet▲ MonthProductsOutletsMonthsSales & inventory

See what matters.

Monthly sales

IDR, January–June 2026

  • SalesIDR 835.4M in June
Monthly sales, IDR, January–June 2026
MonthSales (IDR M)
Jan782.8
Feb842.6
Mar994.7
Apr712.1
May801.5
Jun835.4

June: IDR 835.4M, up IDR 33.9M (4.2%) on May

Monthly sales by format

IDR, January–June 2026

  • RTDIDR 608.1M in June
  • PowderIDR 227.3M in June
Monthly sales by format, IDR, January–June 2026
MonthRTD (IDR M)Powder (IDR M)
Jan581.5201.2
Feb624.1218.5
Mar713.8280.9
Apr515.3196.8
May579.3222.2
Jun608.1227.3

June sales by format

Share of IDR 835.4M

  • RTD72.8% · IDR 608.1M
  • Powder27.2% · IDR 227.3M

Ask what’s driving it.

Monthly sales June IDR 835.4M, up IDR 33.9M (4.2%) on May

You ask

What’s driving this change?

Splitting the May–June change by formatWorked from

  • Sales = offtake
  • May vs June 2026
  • By format

Cognizon answers

Sales rose IDR 33.9M (4.2%) from May to June. RTD accounts for IDR 28.9M of the increase and powder for IDR 5.0M, so most of the change came from RTD.

Where the IDR 33.9M rise came from

Change in sales, May to June 2026

  • RTD+IDR 28.9M
  • Powder+IDR 5.0M
Where the IDR 33.9M rise came from, Change in sales, May to June 2026
FormatChange (IDR M)
RTD+28.9
Powder+5.0
  • RTD +IDR 28.9M
  • Powder +IDR 5.0M
  • Total +IDR 33.9M

[1] Sales report · offtake value · May–June 2026

Build on what you already know.

Using your business context

Business definition

“Sales means offtake—what outlets sold—not our shipments to distributors.”

In Memory · said in chat

Preference

Show money in IDR millions.

In Memory · picked up from a conversation

Suggested for Memory

RTD accounts for IDR 28.9M of the IDR 33.9M May–June rise.

Waits for reviewApproved in review · kept for the team

Everything kept is listed in Memory, where you can check or correct it.

Turn the answer into action.

Dashboard for monitoring

Monthly sales

IDR, January–June 2026

  • SalesIDR 835.4M in June
Monthly sales, IDR, January–June 2026
MonthSales (IDR M)
Jan782.8
Feb842.6
Mar994.7
Apr712.1
May801.5
Jun835.4

Monthly sales June IDR 835.4M, up IDR 33.9M (4.2%) on May

You add it from the chat

Where the IDR 33.9M rise came from

Change in sales, May to June 2026

  • RTD+IDR 28.9M
  • Powder+IDR 5.0M
Where the IDR 33.9M rise came from, Change in sales, May to June 2026
FormatChange (IDR M)
RTD+28.9
Powder+5.0

Memo you write it up to share

Finding

Sales rose 4.2% from May to June; RTD accounts for IDR 28.9M of the IDR 33.9M rise.

Recommendation

Put RTD first in the July review: it carries 85% of the May–June rise.

Evidence · change in sales, May to June 2026
RTD+IDR 28.9M+5.0%
Powder+IDR 5.0M+2.3%
Total+IDR 33.9M+4.2%

Sales report · offtake value · May–June 2026

Export the memoPDFPowerPoint
Ask the next question.

Monthly sales June IDR 835.4M, up IDR 33.9M (4.2%) on May

You ask

How did Greater Jakarta do in June?

Using your business contextUsed your business context

  • Sales = offtake
  • Approved: RTD led the rise
  • May vs June 2026

Cognizon answers

Sales in Greater Jakarta rose 7.5% to IDR 343.0M in June, up IDR 24.1M—the largest gain of the four areas. RTD made up IDR 20.2M of it, the same pattern as the overall rise.

Change in sales by area

Change in sales, May to June 2026

  • Greater Jakarta+IDR 24.1M
  • West Java+IDR 1.3M
  • East Java−IDR 2.7M
  • Sumatera+IDR 11.3M
Change in sales by area, Change in sales, May to June 2026
AreaChange (IDR M)
Greater Jakarta+24.1
West Java+1.3
East Java−2.7
Sumatera+11.3
  • Greater Jakarta +IDR 24.1M
  • RTD there +IDR 20.2M
  • All areas +IDR 33.9M

[1] Sales report · by area · May–June 2026

Knowledge

Build on what your business already knows.

Keep business definitions, important context, and past findings close to the analysis—so the next question doesn’t start from scratch.

Kept in Memory

  • Business definition

    “Sales means offtake—what outlets sold—not our shipments to distributors.”

    Said in chat

  • Past finding

    June sales rose 4.2%; RTD drove IDR 28.9M of the IDR 33.9M increase.

    From a checked memo

  • Preference

    Show money in IDR millions.

    Picked up from a conversation

Everything kept is listed in Memory, where you can check or correct it.

A later conversation

How did Greater Jakarta do in June?

Sales in Greater Jakarta rose 7.5% to IDR 343.0M in June, up IDR 24.1M—the largest gain of the four areas. RTD made up IDR 20.2M of it, the same pattern as the overall rise.

Share

Give your team a clear next move.

Send the memo as a PDF or PowerPoint, with the dashboard behind it a click away.

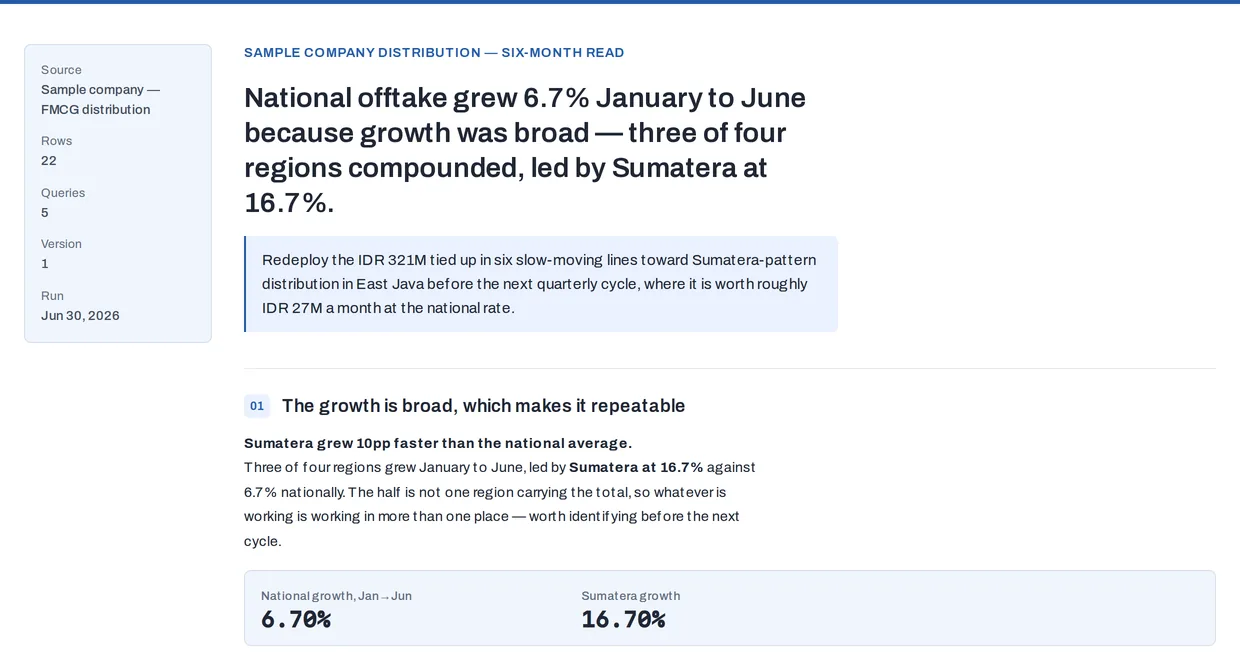
A Cognizon memo: the finding that national offtake (sales) grew 6.7% January to June because growth was broad, led by Sumatera at 16.7%; a recommendation to redeploy IDR 321M tied up in six slow-moving lines; then the first section with its supporting figures, 6.70% national growth and 16.70% Sumatera growth.

On the dashboard

Six-month sales by area

Share of IDR 4,969.0M, January–June 2026

  • Greater Jakarta39.7% · IDR 1,972.2M
  • West Java24.2% · IDR 1,203.4M
  • East Java19.2% · IDR 952.7M
  • Sumatera16.9% · IDR 840.7M
Six-month sales by area, Share of IDR 4,969.0M, January–June 2026
AreaSix months (IDR M)Share
Greater Jakarta1,972.239.7%
West Java1,203.424.2%
East Java952.719.2%
Sumatera840.716.9%

Monthly sales by area

IDR, January–June 2026

  • Greater JakartaIDR 343.0M in June
  • West JavaIDR 197.4M in June
  • East JavaIDR 146.9M in June
  • SumateraIDR 148.0M in June
Monthly sales by area, IDR, January–June 2026
MonthGreater Jakarta (IDR M)West Java (IDR M)East Java (IDR M)Sumatera (IDR M)
Jan308.9184.0163.1126.8
Feb339.3200.4165.3137.6
Mar371.1250.5197.7175.4
Apr291.1174.9130.0116.1
May318.9196.2149.6136.8
Jun343.0197.4146.9148.0
Recommendation first, with the numbers that support it.Export the memoPDFPowerPointShare by link

Use cases

Built for messy business workflows.

Wherever business data gets scattered across exports, joined by hand, and turned into the same recurring decision, Cognizon does the analytical work. These are three common ways teams use it — not the only ones.

Not your exact role? Cognizon works with the files, exports, metrics, and business context your team already uses.

Explore all use cases

Bring your business data. Cognizon handles the rest.

Start with the files your team already uses.

Get started